Output and Display Options
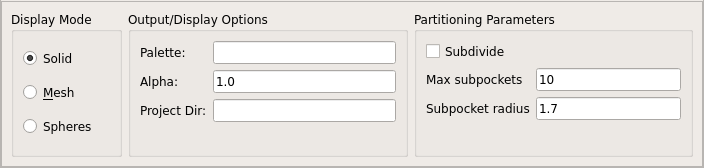
GUI section controlling output and display options with argument mapping: Display Mode radio button → display_mode, Palette → palette, Alpha → alpha, and Project Dir → project_dir
File Output Options
PyVOL always creates an output directory. It looks for a project directory (project_dir argument) and then creates an output directory (output_dir) within it. If a project directory is not provided, the current working directory is used. The output directory and all included files are named by default using a prefix consisting of a timestamp followed by a system-compatible chunk of the protein identifier (filename or selection string). The prefix can be set using the prefix argument.
A minimum of six files are produced in a completed calculation: 1) input protein geometry (prefix`_prot.pdb), 2) a configuration file recording all options to recapitulate a calculation (`prefix.cfg), 3) a detailed log output (prefix.log), 4) a report of all calculated volumes (prefix.rept), and pocket geometry information contained in two files: 5) surface geometry (prefix`_p`n.obj) and 6) tangent sphere definitions (prefix`_p`n.xyzrg). If multiple pockets are calculated (e.g., all and subdivide runs), pocket geometry files are written for each.
# arguments: project_dir, output_dir, prefix
pocket prot_file=<protein_pdb_filename>, project_dir=<directory>, output_dir=<sub-directory>, prefix=<identifier>
pocket protein=<"PyMOL selection string">, project_dir=<directory>, output_dir=<sub-directory>, prefix=<identifier>
Logger Options
PyVOL output is done through loggers. Logger handler levels can be configured via the logger_stream_level and logger_file_level arguments. The logger_stream_level controls the level of information printed to the screen during runs. The logger_file_level sets the amount of information written to the log file. Default levels of the stream and file handlers are respectively “INFO” and “DEBUG”. This provides a more limited summary at run time with further details written to file.
# arguments: project_dir, output_dir, prefix
pocket prot_file=<protein_pdb_filename>, logger_stream_level="INFO", logger_file_level="DEBUG"
pocket protein=<"PyMOL selection string">, logger_stream_level="INFO", logger_file_level="DEBUG"
Display Options
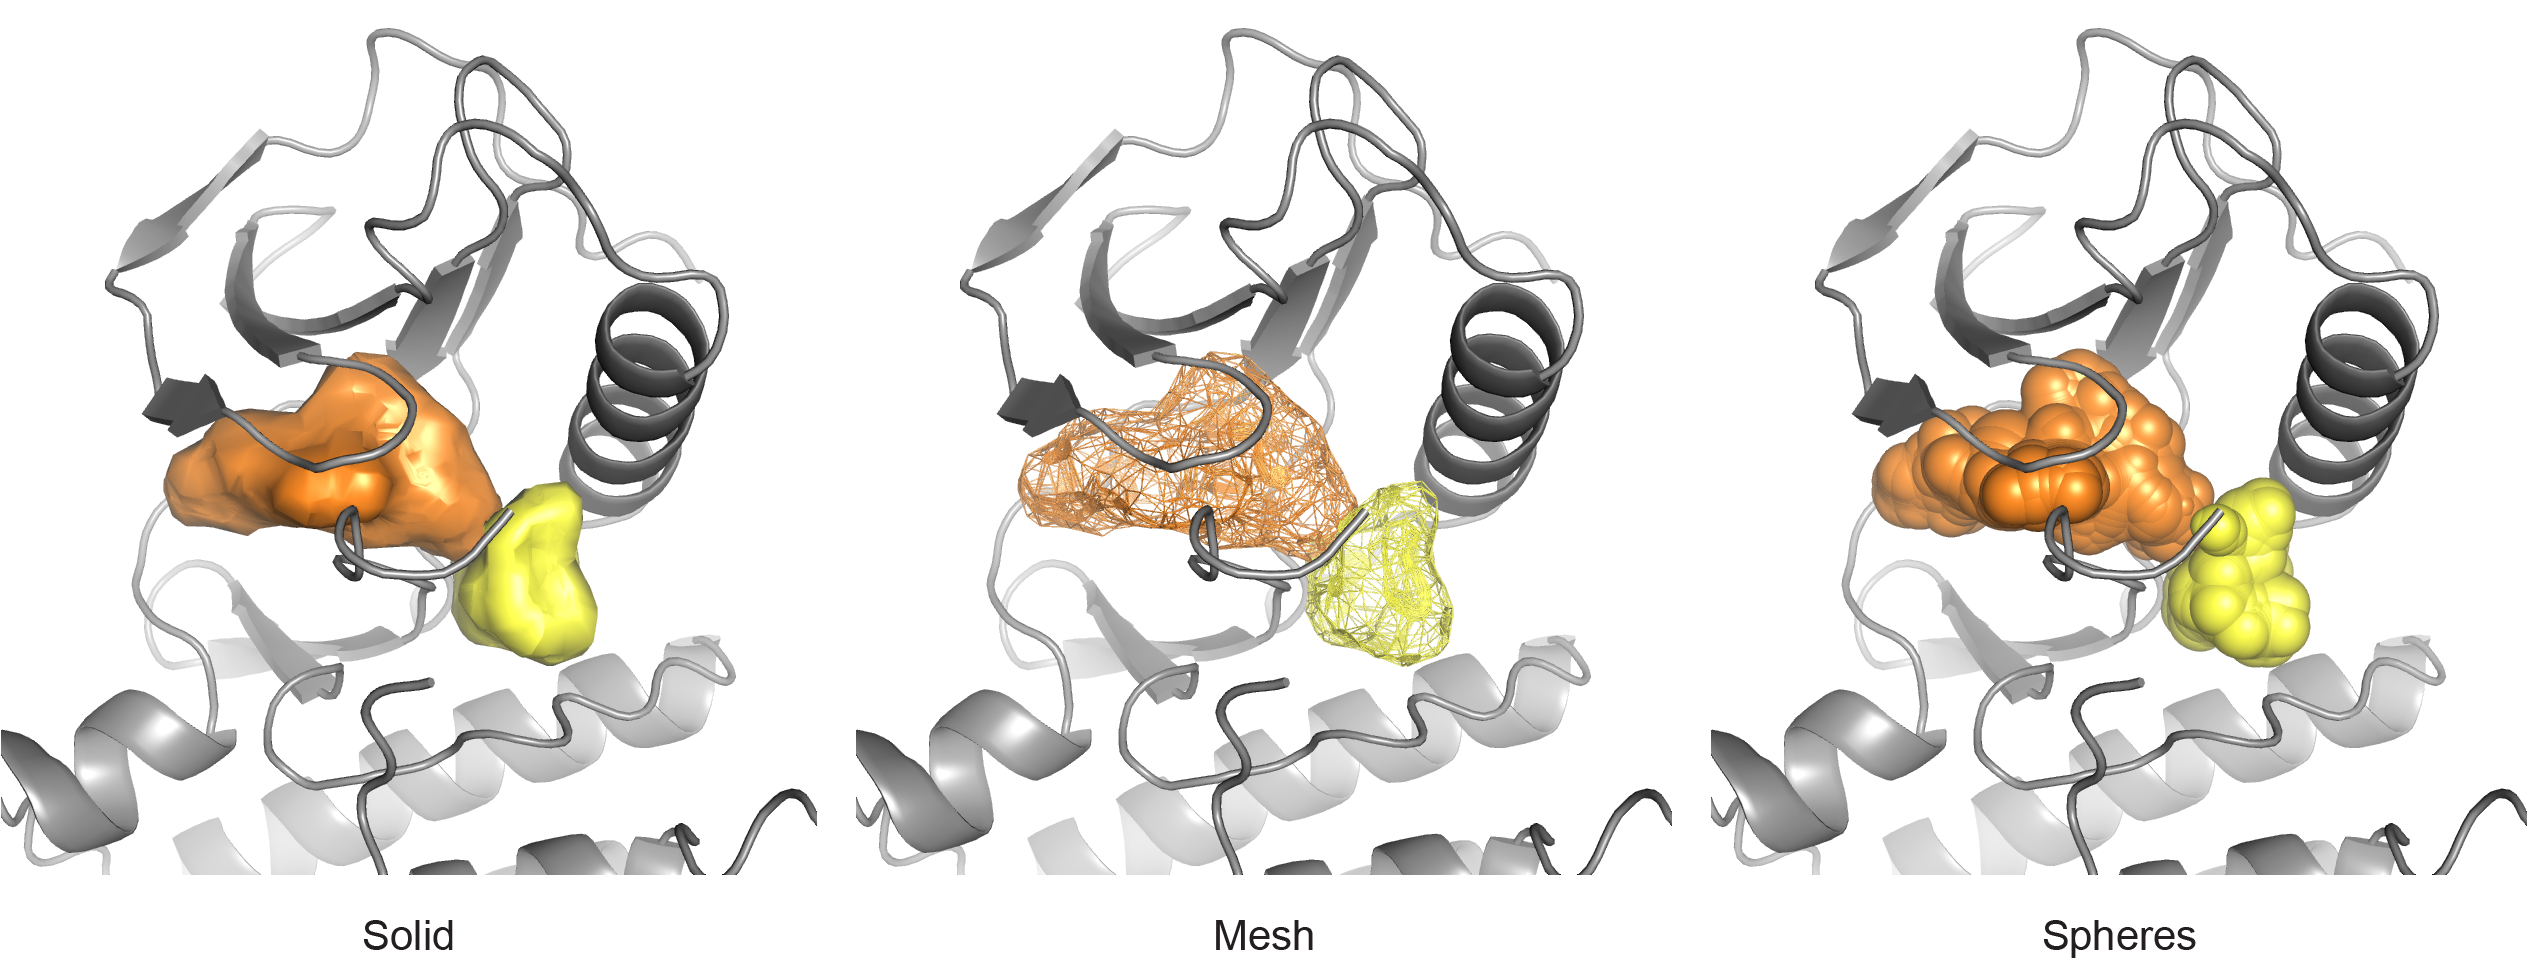
Examples of the three primary display modes.
When running through PyMOL or loading previous results into a PyMOL session, calculated surfaces can be visualized in any of three different ways by setting the display_mode parameter. Surfaces can be represented using a solid mesh (solid), a wireframe mesh (mesh), or a group of spheres (spheres). Transparency (when applicable) is set with the alpha argument: a float [0,0, 1.0] that is equal to (1 - transparency). The displayed color of surfaces is controlled using the palette parameter. For non-programmatic invocation, the palette is interpreted as a comma-separated list of PyMOL color strings or space-separated RGB floats. A default palette is automatically selected, and additional colors are automatically interpolated when more surfaces need to be displayed. If 5 colors need to be chosen from an input palette of 4 colors, the first and fifth palette colors are the first and fourth of the input colors. The second color contains 2/3 of the first and 1/3 of the second input colors through linear interpolation. The second through fourth colors are similarly interpolated.
# arguments: display_mode, alpha, palette
pocket protein=<"PyMOL selection string">, display_mode=mesh
pocket protein=<"PyMOL selection string">, display_mode=solid, alpha=0.85
pocket protein=<"PyMOL selection string">, display_mode=spheres
pocket protein=<"PyMOL selection string">, mode=all, display_mode=solid, palette="tv_red,tv_orange,0.34 0.26 0.74"
pocket protein=<"PyMOL selection string">, mode=largest, subdivide=True, display_mode=mesh, palette="marine,forest_green,magenta,cyan"
Note
Specifying non-standard colors for display purposes can be syntactically difficult. The easiest way to match RGB values, for instance to other figure elements, is to edit the produced configuration file and reload the results into PyMOL using Loading Previous Results.